3 Whom to Talk To
Where this chapter fits. Step 5 of the research process is to plan the sample. This chapter covers whom to interview, how to reach them, and when to stop.
3.1 Twelve People at a Meeting
A city wants to understand how residents of one neighborhood think about safety. The case is a composite written for this book.
A staff member attends the monthly neighborhood meeting and invites people to be interviewed. Twelve agree. All twelve own their homes, and ten have lived in the neighborhood for more than twenty years. Ten are over age 60. They describe speeding cars, a vacant lot, and teenagers in the park after dark.
The city now has twelve interviews, and they agree with one another. It would be easy to report that “residents are concerned about youth in the park.”
The twelve were the people who attend evening meetings. Renters make up half the neighborhood, and none were interviewed. No one under 30 was interviewed, and no parent of a teenager. The teenagers in the park were not asked what they think about safety either. The interviews show how one group of residents sees the neighborhood. They do not show how the neighborhood sees itself.
The problem is not the number twelve. Twelve can be enough. The problem is which twelve. This chapter covers how to choose participants for a qualitative study and how to decide when to stop.
3.2 A Different Logic of Sampling
A survey draws a random sample so that the results can be generalized to a population. Chance decides who is included, and the researcher’s judgment is kept out.
A qualitative study works the other way. The researcher chooses each participant for what that person can explain. This is purposive sampling. The aim is to learn about the range of experiences and the reasons behind them. Patton (2015) calls the people chosen “information-rich cases.”
Purposive sampling is not the same as convenience. A convenience sample takes whoever is easiest to reach, as the city did at the meeting. A purposive sample follows a plan, and the researcher can state the reason for each choice.
3.3 Strategies for Choosing
Several strategies are in common use. A study often combines two or three.
Maximum variation. The researcher seeks participants who differ as much as possible on the characteristics that matter. For the safety study, those could be tenure, age, length of residence, and the block a person lives on. A pattern that appears across very different people is stronger evidence than one found in a uniform group.
Criterion sampling. Every participant meets a stated condition. A study of eviction could include only people who received a notice in the past year.
Typical case. The researcher chooses cases that are ordinary for the group, to describe the common experience.
Extreme or deviant case. The researcher chooses unusual cases, such as the one block with no reported incidents. Unusual cases can show what makes the ordinary ones ordinary.
Snowball sampling. Each participant is asked to suggest others. It reaches people who are on no list, and it depends on trust passed from one person to the next. People tend to refer others like themselves, and that is the weakness of the method. A snowball that starts at the neighborhood meeting will stay among the people who attend it. Start from several unconnected people to reduce this.
Theoretical sampling. The researcher analyzes the first interviews and then chooses the next participants to test or extend the ideas that are forming. If early interviews suggest that renters and owners see safety differently, the researcher seeks more renters. This strategy comes from grounded theory (Glaser and Strauss, 1967).
A key informant is a person with special knowledge of the setting, such as a school principal, a store owner, or a block captain. Key informants can describe the setting and introduce the researcher to others. They speak from their own position, and their account should not stand in for the residents’.
3.4 A Sampling Plan
A simple table turns a strategy into a plan. List the characteristics that matter down the side and the groups across the top. Then set a target for each cell. Table 3.1 shows a plan for the safety study.
| Lived here under 5 years | Lived here 5 to 20 years | Lived here over 20 years | |
|---|---|---|---|
| Renters | 3 | 2 | 1 |
| Homeowners | 1 | 2 | 3 |
| Youth ages 15 to 19 | 2 | 2 | Not applicable |
| People who work in the neighborhood | 2, of any length of time |
The plan has 18 interviews. It does not match the neighborhood in proportion, and it does not need to. Its purpose is to make sure that each kind of experience is heard. The plan also shows the reader of the final report who was included and why.
The plan can change. If the first interviews show that parents of young children have distinct concerns, the researcher can add a row. Record each change with its reason.
3.5 Reaching People
A plan names the people the study needs. Recruitment is the work of reaching them.
A gatekeeper is a person or organization that controls access to a group. A tenant association, a youth center, and a faith leader are examples. A gatekeeper’s support can make a study possible. It also shapes who is reached. A youth center can introduce the researcher to the teenagers who attend the center, and not to those who avoid it. Use more than one gatekeeper where possible.
Three practical points apply to most studies.
- Go where people are. Residents who do not attend meetings may be at the laundromat, the bus stop, or the school pickup line. Recruit at different places and at different times of day.
- Make it easy to say yes. Offer times outside working hours. Offer to meet by phone. Provide child care or a ride if the budget allows.
- Pay people for their time. A payment of 25 to 50 dollars for an hour is common. It shows respect, and it lets people take part who cannot afford to give an hour away. Chapter 4 covers the point at which payment becomes pressure.
Keep a record of everyone who was invited, who agreed, and who declined. People who decline are information too. If every renter the researcher approached said no, the report should say so.
3.6 When to Stop
A survey sets its sample size in advance with a formula. A qualitative study has no formula. The usual guide is saturation. Saturation is the point at which new interviews add little that is new to the analysis.
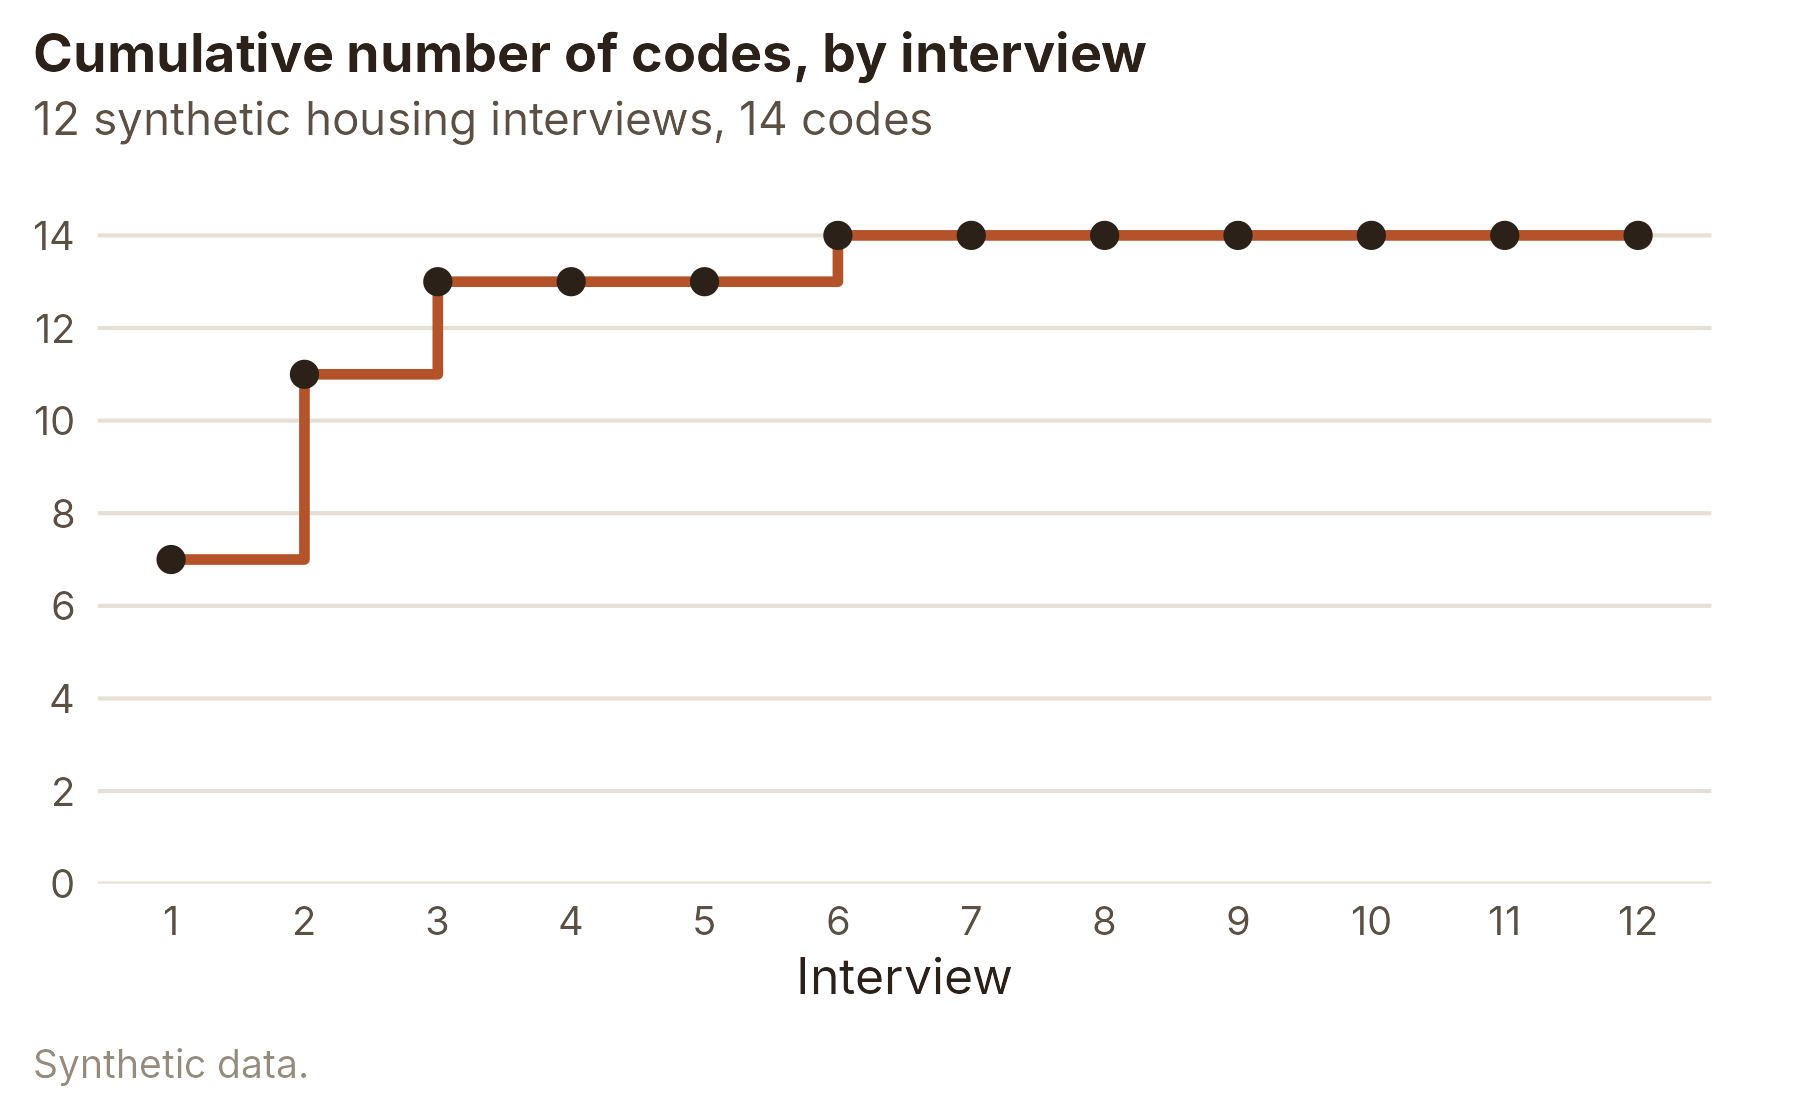
The idea can be made concrete. Figure 3.1 uses the 12 synthetic housing interviews from this book. Chapter 5 will code them with 14 codes. The figure shows how many of the 14 codes had appeared by the end of each interview.
The line rises quickly and then flattens. After interview 3, 13 of the 14 codes have appeared. Interviews 4 and 5 add none. Interview 6 adds the last one, and interviews 7 through 12 add none.
The step at interview 6 carries a warning. That participant moved by choice and described the move as a good one. The first five participants had all been forced to move or feared that they would be. Had the study interviewed only renters in difficulty, the line would have stayed flat after interview 3. The researcher could have stopped there and never heard the other kind of account. Saturation is measured within the kinds of people a study has reached. A flat line among similar participants shows that the study has heard that group. It does not show that the study has heard every group.
Research on real studies gives rough guidance on numbers. Guest, Bunce, and Johnson (2006) analyzed 60 interviews and tracked when each code first appeared. Most of the frequent codes had appeared within the first six interviews, and nearly all had appeared by the twelfth. Hennink and Kaiser (2022) reviewed 23 studies that measured saturation. Those studies reached it after 9 to 17 interviews or 4 to 8 focus groups. In most of them, the participants were fairly similar and the aims were narrow.
These figures are a starting point. A study with a broad question or a varied group needs more interviews. Malterud, Siersma, and Guassora (2016) suggest that researchers ask how much information power the sample holds. A sample holds more when the aim is narrow, the participants are well chosen for the aim, and the interviews are rich. Such a sample can be smaller.
3.7 Work With the Data: Saturation Tracker
Saturation is easier to judge with a chart. The 12 synthetic housing interviews were coded with 14 codes, and Chapter 5 shows how. The tool plots how many distinct codes have appeared after each interview.
Open Saturation Tracker in its own window
- Start with “Original order.” Find the interview after which the line stops rising.
- Choose “Renters in difficulty first.” Note where the line goes flat, and which later interviews add the last codes.
- Choose “Most different people first.” Compare how quickly the line rises.
- Press “Shuffle” several times. The same 12 interviews produce a different curve each time.
The point at which the line goes flat depends on the order of the interviews. A flat line among similar people shows that those people have little more to add. It does not show that every kind of person has been heard. This is why a stopping rule should be tied to the sampling plan.
The file housing-interviews-index.csv at qual.marginoferrormedia.com/data lists the 12 participants.
State the Stopping Rule in Advance
Decide before the study how you will judge saturation. One workable rule comes from Francis and colleagues (2010). Conduct a set number of interviews, such as ten. Then continue until three interviews in a row add no new codes. Report the rule and what happened when you applied it.
3.8 Describing the Sample
A qualitative report describes its participants in enough detail for a reader to judge the findings. The description usually takes the form of a table. Table 3.2 shows the participants in the synthetic housing corpus.
| Transcript | Pseudonym | Description |
|---|---|---|
| H01 | Avery | Renter, age 34, two children, works in a warehouse |
| H02 | Sasha | Renter, age 61, lives alone, retired on a fixed income |
| H03 | Riley | Renter, age 27, restaurant server, lives with a partner |
| H04 | Jordan | Renter, age 45, home health aide, three children |
| H05 | Casey | Renter, age 52, lost housing after a divorce, slept in a car for four months |
| H06 | Quinn | Renter, age 38, moved by choice to a smaller city, works remotely |
| H07 | Robin | Landlord, age 58, owns six units in two older buildings |
| H08 | Akira | Housing caseworker at a nonprofit, age 41, nine years in the job |
| H09 | Devon | Renter, age 23, community college student, shares a house with four others |
| H10 | Noor | Renter, age 36, arrived in the country six years ago, two children, works in food processing |
| H11 | Imani | Renter, age 48, bus driver, cares for a parent with dementia |
| H12 | Rene | Renter, age 31, single parent, moved into subsidized housing eight months ago |
The table shows a reader several things at once. Ten of the twelve are renters. One is a landlord and one is a caseworker. The renters range in age from 23 to 61. No participant is a property manager for a large company, and none is a current shelter resident. A reader can see what the corpus covers and what it leaves out.
The table also raises a privacy question. In a small community, a description such as “bus driver, age 48, cares for a parent with dementia” could identify a real person. With real participants, a researcher has to decide how much detail is safe to print. Chapter 4 covers that decision.
Ethics Moment: The Gatekeeper’s Influence
A caseworker offers to recruit her own clients for a study of the housing program she works for. The offer is generous, and it creates two problems. Clients may feel that they cannot say no to a person who controls their benefits. They may also feel that they cannot speak freely about the program. The researcher should ask the caseworker only to pass along a flyer. Clients then contact the researcher directly, and the caseworker never learns who took part. The consent form should state that the decision to take part has no effect on services.
AI Reality Check: Participants Who Are Not Who They Say
Studies that recruit online and pay participants now attract people who invent an identity to collect the payment. Some use a language model to write plausible answers to screening questions. Ridge and colleagues (2023) describe such “imposter participants” in health research. A few checks help. Ask a screening question that only a real member of the group could answer in detail. Hold a short call before the interview. Be cautious when many replies arrive within minutes of posting. Recruitment through a trusted local organization is slower and much harder to fake. A related product, the AI “persona” that answers as a renter or a parent, is not a participant at all.
3.9 Putting It All Together
A qualitative study chooses participants on purpose for what they can explain. Maximum variation, criterion, typical case, extreme case, snowball, and theoretical sampling are the main strategies. A sampling plan sets a target for each kind of participant and shows a reader who was included and why.
Recruitment shapes the sample as much as the plan does. Gatekeepers open access to some people and not to others, and a record of who declined is part of the data.
Saturation is the point at which new interviews add little. Published studies often reach it between 9 and 17 interviews when the group is fairly similar. Saturation within one kind of participant does not show that other kinds have been heard.
3.10 Looking Ahead
The researcher now knows whom to interview. Those people will be asked to describe private and sometimes painful parts of their lives. Chapter 4 covers what the researcher owes them. The case is a study with immigrant families who have reasons to be careful about what they say and to whom.
3.11 Further Reading and References
- Patton, M. Q. (2015). Qualitative Research and Evaluation Methods (4th ed.). Sage. The standard reference on purposive sampling strategies.
- Guest, G., Bunce, A., and Johnson, L. (2006). How many interviews are enough? An experiment with data saturation and variability. Field Methods, 18(1), 59 to 82.
- Hennink, M., and Kaiser, B. N. (2022). Sample sizes for saturation in qualitative research: A systematic review of empirical tests. Social Science and Medicine, 292, 114523.
- Malterud, K., Siersma, V. D., and Guassora, A. D. (2016). Sample size in qualitative interview studies: Guided by information power. Qualitative Health Research, 26(13), 1753 to 1760.
- Francis, J. J., Johnston, M., Robertson, C., and others (2010). What is an adequate sample size? Operationalising data saturation for theory-based interview studies. Psychology and Health, 25(10), 1229 to 1245.
- Glaser, B. G., and Strauss, A. L. (1967). The Discovery of Grounded Theory. Aldine.
- Ridge, D., Bullock, L., Causer, H., and others (2023). “Imposter participants” in online qualitative research, a new and increasing threat to data integrity? Health Expectations, 26(3), 941 to 944.
3.12 Key Terms
- Convenience sample. A sample of whoever is easiest to reach.
- Criterion sampling. Choosing participants who all meet a stated condition.
- Gatekeeper. A person or organization that controls access to a group.
- Information power. How much a sample can show about the research aim.
- Key informant. A person with special knowledge of a setting.
- Maximum variation. Choosing participants who differ as much as possible on the characteristics that matter.
- Purposive sampling. Choosing each participant for what that person can explain.
- Saturation. The point at which new interviews add little that is new to the analysis.
- Snowball sampling. Asking each participant to suggest others.
- Theoretical sampling. Choosing the next participants to test or extend ideas from the analysis so far.
3.13 Exercises
Check Your Understanding
- Explain the difference between purposive sampling and convenience sampling. Which one did the city use at the neighborhood meeting?
- What is the main weakness of snowball sampling, and how can a researcher reduce it?
- Define saturation. Why can a study reach saturation and still have missed an important group?
- Why should a researcher keep a record of people who declined to take part?
Apply It
- Build a sampling plan for this study. “How do employees at a mid-sized company experience the return to the office?” Name two characteristics that matter, draw the table, and set a target for each cell.
- Use the file
housing-coded-segments.csv. Count the distinct codes in transcripts H01 through H04. Then count how many new codes transcripts H05 through H08 add. - Write a one-paragraph recruitment flyer for the neighborhood safety study that is aimed at renters under age 30. State where you would post it.
Think Deeper
- A researcher completes ten interviews with nurses at one hospital and reports saturation. A reviewer asks whether the findings would hold at a rural clinic. How should the researcher respond?
- A study pays 100 dollars for a one-hour interview in a low-income neighborhood. Argue that the payment is fair. Then argue that it is a problem. Where would you set it?
- Look at Table 3.2. Suppose these were real participants in a town of 5,000 people. Which descriptions could identify someone? Rewrite two of them to lower the risk and note what information is lost.